

Wallbridge Mining Completes Updated Positive Preliminary Economic Assessment of Fenelon Gold Project
/EIN News/ -- WEBINAR TO BE HELD ON FRIDAY, MARCH 28 @ 10:00 AM EDT
Register here:
https://6ix.com/event/wallbridge-mining-corporate-update
TORONTO, March 27, 2025 (GLOBE NEWSWIRE) -- Wallbridge Mining Company Limited (TSX:WM, OTCQB:WLBMF) (“Wallbridge” or the “Company”) is pleased to report results from an updated positive Preliminary Economic Assessment (“PEA”) completed on its 100%-owned Fenelon gold project (“Fenelon” or the “Project”) located in the Abitibi Greenstone Belt, along the Detour-Fenelon Gold Trend, Quebec. A PEA prepared in accordance with National Instrument 43-101 – Standards of Disclosure for Mineral Projects (“NI 43-101”) has been filed on SEDAR+ and is available on the Company’s website and can be accessed here.
All results herein are reported in Canadian dollars unless otherwise indicated.
PEA HIGHLIGHTS
- Average annual gold production of 107,000 oz per year over 16-year life of mine (“LOM”); 96% average gold recovery
- Average annual gold production of 127,000 oz during the first five years
- Average annual free cash flow of $120 million over LOM
- After-tax Internal Rate of Return (“IRR”) of 21%
- After-tax Net Present Value (“NPV”) of $706 million at base case gold price of US$2,200 and CAD$:US$ of 1.35:1.00 at a 5% discount rate
- Initial capital expenditures (1) of $579 million
- Sustaining capital expenditures (1) of $449 million
- Total cash costs (1) of US$851/oz
- All-in sustaining costs (1) (“AISC”) of US$1,046/oz
- 16.6 Mt of mineralized material mined at an average grade of 3.34 g/t
- Non-IFRS financial measures with no standardized definition under IFRS. Refer to Non-IFRS Measures at end of this news release.
The Company cautions that the results of the PEA are preliminary in nature and include inferred mineral resources that are considered too speculative geologically to have economic considerations applied to them to be classified as mineral reserves. There is no certainty that the results of the PEA will be realized.
Brian Penny, CEO of Wallbridge, commented:
“Fenelon is a gold project with tremendous potential. This updated Fenelon PEA generates strong project economics under a lower risk, higher grade, lower startup capital scenario. Fenelon has now reached another milestone with a robust PEA that demonstrates a viable path to development and attractive economic returns based on reasonable assumptions. The PEA was designed to be rigorous, using current cost data from contractors, suppliers and mining companies operating in the region to arrive at realistic projections. It represents a new starting point to build upon as we scope out the full opportunities at Fenelon and Martiniere, the two most advanced projects on our large, underexplored property.
In this historically high gold price environment, we need to rapidly advance the project. The current plan has a shorter payback than the previous plan and allows us to consider expansion options after payback has been achieved.
I would like to thank everyone who contributed to the completion of this study, as well as our employees, stakeholders, and shareholders for their continuous support. I believe Wallbridge has a bright future, and we look forward to taking the necessary steps to increase value for our shareholders.”
Table 1: PEA Summary of Key Metrics and Project Economics
| SUMMARY OF PROJECT ECONOMICS | Mar 21, 2025 | |
| Base case gold price | (US$) | 2,200 |
| Exchange rate | (CAD$:US$) | 1.35:1.00 |
| Discount rate | (%) | 5.0 |
| NSR Royalty on Fenelon Mine Property | (%) | 4.0 |
| Mining Parameters | ||
| Average grade mined | (g/t) | 3.34 |
| Cut-off grades | (g/t) | 2.25 (CTC) 2.51 (A51) |
| Mining rate | (tpd) | 3,000 |
| Total tonnage mined | (Mt) | 16.6 |
| Mine life | (years) | 16.0 |
| Processing Parameters | ||
| Processing recovery | (%) | 96.0 |
| Processing rate | (tpd) | 3,000 |
| Total tonnage milled | (Mt) | 16.6 |
| Average annual production | (oz/year) | 107,000 |
| Average annual production(first five years) | (oz/year) | 127,000 |
| Total production | (oz) | 1,711,000 |
| Capital Expenditures | ||
| Initial capital expenditure(3) | ($M) | 579 |
| Sustaining capital expenditure(3) | ($M) | 449 |
| Closure costs(3) | ($M) | 9 |
| Salvage value | ($M) | 26 |
| Operating Costs | ||
| Total operating costs | ($/t milled) | 106 |
| Cost Per Ounce | ||
| LOM total cash costs(1) (3) | (US$/oz) | 851 |
| LOM all-in sustaining costs(2) (3) | (US$/oz) | 1,046 |
| Financial Analysis | ||
| Pre-tax NPV5% | ($M) | 1,176 |
| Pre-tax IRR | (%) | 27 |
| Post-tax NPV5% | ($M) | 706 |
| Post-tax IRR | (%) | 21 |
| Post-tax payback period (from start of commercial production) | (years) | 4.0 |
| Profitability Index (post-tax NPV5%/initial capital) | - | 1.22 |
- Total cash costs per ounce are operating costs, composed of mining (UG and OP), processing, water treatment and tailings, minesite G&A and royalty costs, divided by payable gold ounces.
- AISC/oz includes operating costs, sustaining capital expenditures to support the on-going operations, and closure costs, divided by payable gold ounces.
- Non-IFRS financial measures with no standardized definition under IFRS. Refer to note at end of this news release.
Financial Analysis
The PEA assumes a base case gold price of US$2,200/oz. Using that base case assumption, the Project generates an after-tax NPV of $706 million using a 5% discount rate and an after-tax IRR of 21%.
The Project generates cumulative free cash flow of $1,367 million and averages annual free cash flow of $120 million over a mine life of 16 years (Figure 1). Total taxes payable over LOM at the base case gold price is $776 million.
Figure 1. Annual After-Tax Free Cash Flow (millions)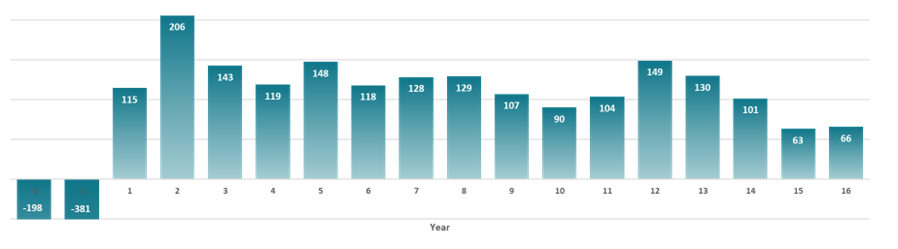
Sensitivities
The PEA financial economic analysis is significantly influenced by gold prices. At a gold price of US$3,000/oz and FX of CAD$:US$ of 1.35:1.00, the Project generates an after-tax NPV of $1,381 million and an after-tax IRR of 34% with a payback period of 2.4 years from the start of commencement of production (Table 2).
Table 2: PEA Sensitivity Analysis Gold Price
|
Gold Price (USD) |
FX | NPV ($M) | IRR | Payback (Years) |
| 1800 (-18%) | 1.35 | 353 | 13% | 5.7 |
| 1900 (-14%) | 1.35 | 443 | 15% | 5.0 |
| 2000 (-9%) | 1.35 | 532 | 17% | 4.6 |
| 2100 (-5%) | 1.35 | 619 | 19% | 4.3 |
| 2200 | 1.35 | 706 | 21% | 4.0 |
| 2300 (+5%) | 1.35 | 792 | 22% | 3.7 |
| 2400 (+9%) | 1.35 | 878 | 24% | 3.4 |
| 2500 (+14%) | 1.35 | 963 | 26% | 3.1 |
| 2600 (+18%) | 1.35 | 1047 | 27% | 2.9 |
| 3000 (+36%) | 1.35 | 1381 | 34% | 2.4 |
| Operating Costs | NPV ($M) | IRR |
| Base Case -30% | 912 | 25% |
| Base Case -20% | 845 | 24% |
| Base Case -10% | 776 | 22% |
| Base Case 0% | 706 | 21% |
| Base Case +10% | 635 | 19% |
| Base Case +20% | 563 | 18% |
| Base Case +30% | 490 | 16% |
| Capital Expenditures | NPV ($M) | IRR |
| Base Case -30% | 855 | 30% |
| Base Case -20% | 806 | 26% |
| Base Case -10% | 756 | 23% |
| Base Case 0% | 706 | 21% |
| Base Case +10% | 655 | 19% |
| Base Case +20% | 604 | 17% |
| Base Case +30% | 552 | 15% |
Production
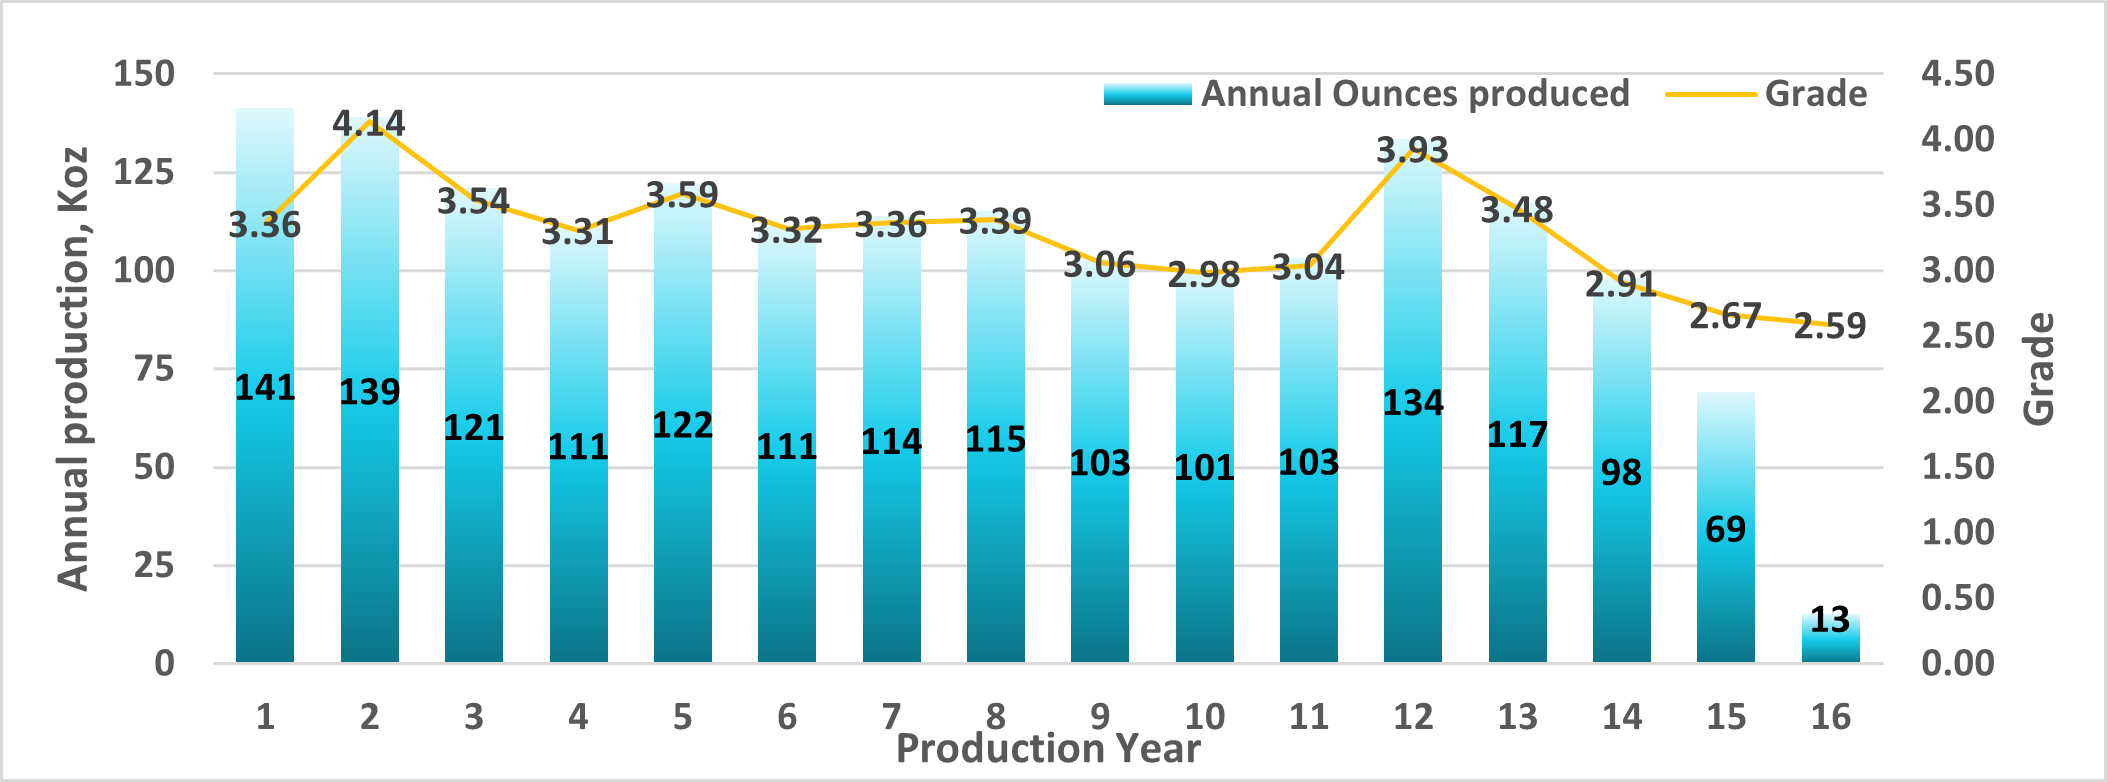
Annual production over LOM is expected to average 107,000 ounces with peak production of 141,000 ounces in year 1 (Figure 2).
Figure 2. Production Profile
Capital Expenditures
The initial capital expenditures are estimated at $579 million, and the sustaining capital expenditures are estimated at $449 million (Tables 3 & 4). A contingency of $57 million and $20 million is included in initial and sustaining capital expenditures, respectively.
Initial and sustaining capital expenditures were estimated based on current costs received from vendors as well as developed from first principles, while some were estimated based on factored references and experience from similar operating projects.
Table 3: Initial Capital Expenditures
| Cost Element | Initial Capital ($M)1,2 |
| Mill | 217 |
| Paste Plant | 43 |
| Tailings and Water Treatment | 22 |
| Capitalized Operating (Pre-production) | 75 |
| Surface Civil & Infrastructure | 80 |
| Mining Equipment | 31 |
| Underground Development | 54 |
| Underground Infrastructure | 28 |
| Hydro Electric Line & Distribution | 29 |
| Total Initial Capital | $579 |
- All values stated are undiscounted. No depreciation of costs was applied.
- Non-IFRS financial measures with no standardized definition under IFRS. Refer to Non-IFRS Measures at end of this news release.
Table 4: Sustaining Capital Expenditures
| Cost Element | Sustaining Capital ($M)1,2,3 |
| Mining Equipment | 145 |
| Development | 161 |
| Tailings & Water Treatment | 64 |
| Paste Distribution Network | 8 |
| Underground Infrastructure | 32 |
| Surface Infrastructure | 29 |
| Closure | 9 |
| Open pit (OB Excavation + Contractor) | 3 |
| Total Sustaining Capital | $449 |
- All values stated are undiscounted. No depreciation of costs was applied.
- Non-IFRS financial measures with no standardized definition under IFRS. Refer to Non-IFRS Measures at end of this news release.
- Due to rounding, columns may not add up.
Total Cash Costs
The total unit cash costs are estimated at US$851/oz. The AISC is estimated at US$1,046/oz. Operating cost estimates were developed using first principles methodology, vendor quotes, and productivities being derived from benchmarking and industry practices.
Table 5: Total Cash Costs
|
LOM Total $ million |
Average LOM ($/tonne milled) |
Average LOM (US$/oz) |
|
| Mining (UG & OP) | 900 | 56 | 390 |
| Processing | 423 | 25 | 183 |
| Water Treatment & Tailings | 66 | 4 | 28 |
| General & Admin. | 374 | 22 | 162 |
| Royalty (4%) | 202 | 12 | 88 |
| Total Cash Costs 2,3 | 1,965 | 119 | 851 |
- All values stated are undiscounted. No depreciation of costs has been applied.
- Non-IFRS financial performance measures with no standardized definition under IFRS. Refer to Non-IFRS Measures at the end of this news release.
- Total cash costs include mining (UG and OP), processing, water treatment and tailings, minesite G&A and royalty costs.
Mineral Resource Estimate
The updated mineral resource estimates (“MRE”) for the Fenelon and Martiniere deposits presented in this news release were prepared by Mauro Bassotti, P.Geo., an independent mineral resource consultant using all available information. The effective date of the 2025 MRE is March 20, 2025. The databases supporting the 2025 MREs are complete, valid and up to date, with close-out dates of October 22, 2024 and January 8, 2025 for Fenelon and Martiniere respectively. The 2025 Mineral Resource Statement for the Detour-Fenelon Gold Trend Property is presented below in Table 6. The statement provides the consolidated estimates for the Fenelon and Martiniere deposits. Details are provided in Item 14 of the PEA technical report.
Table 6: Detour-Fenelon Gold Trend Property 2025 Mineral Resource Statement by Deposit
| DEPOSIT | INDICATED | INFERRED | |||||
| Tonnes (000’s) |
Gold Grade (Au g/t) |
Gold Ounces (000’s) |
Tonnes (000’s) |
Gold Grade (Au g/t) |
Gold Ounces (000’s) |
||
| FENELON | |||||||
| OP @>0.45 g/t Au | 3,121 | 2.50 | 251 | 2,313 | 2.53 | 188 | |
| UG @>1.45 g/t Au | 11,966 | 3.91 | 1,503 | 12,715 | 3.57 | 1,461 | |
| Total | 15,087 | 3.62 | 1,754 | 15,028 | 3.41 | 1,649 | |
| MARTINIERE | |||||||
| OP @>0.49 g/t Au | 3,928 | 1.97 | 249 | 1,982 | 2.22 | 142 | |
| UG LH @>1.60 g/t Au | 750 | 3.89 | 94 | 1,813 | 4.06 | 237 | |
| UG CF @>2.15 g/t Au | 25 | 4.29 | 3 | 75 | 3.62 | 9 | |
| Total | 4,703 | 2.29 | 346 | 3,870 | 3.11 | 387 | |
|
Total Fenelon & Martiniere Open Pit & Underground |
19,790 | 3.30 | 2,100 | 18,899 | 3.35 | 2,037 | |
Notes to accompany the Detour-Fenelon Gold Trend Property 2025 Mineral Resource Statement:
- The effective date of the 2025 MREs is March 20, 2025.
- The 2025 MREs follow CIM Definition Standards (2014) and CIM MRMR Guidelines (2019).
- The qualified person (“QP”) for the 2025 MREs is Mr. Mauro Bassotti (P.Geo.) who is an independent mineral resource consultant.
- The criterion of reasonable prospects for economic extraction has been met by having constraining volumes applied to estimated blocks using GEOVIA Whittle pit optimizer (“Whittle”) software for open pit mineral resources and using Deswik Stope Optimizer (“DSO”) software for underground mineral resources, and by the application of cut-off grades appropriate to the potential mining extraction scenario (i.e., open pit, underground long-hole, underground cut-and-fill). Constraining 3D Whittle open pit and DSO underground stope volumes have been generated based on a gold price assumption of US$2,150 per troy ounce. A minimum mining width of 2.0 m was used for underground stope optimization.
- The potentially economic open pit shells and underground DSO shapes used for reporting the 2025 MREs have been generated by Mr. Simon Boudreau (P.Eng.), Senior Mining Engineer for InnovExplo Inc., a member of Norda Stelo Inc.
- For the Fenelon deposit, sixteen (16) mineralized domains and four (4) surrounding alteration envelopes were modelled in 3D to the true thickness of the mineralization. Supported by measurements, a density value of 2.80 g/cm3 was applied to blocks inside mineralized domains and 2.81 g/cm3 to blocks inside alteration envelopes. High-grade capping was applied to raw assay data and established on a per-zone basis, ranging between 7 g/t Au and 100 g/t Au for the mineralized domains, and a fixed capping value of 10 g/t Au for the alteration envelopes. One-metre (1.0 m) sample assay composites were calculated within the mineralized domains and alteration envelopes using the grade of the adjacent material when assayed or a value of 0.001 when not assayed.
- For the Martiniere deposit, sixteen (16) mineralized domains and ten (10) surrounding alteration envelopes were modelled in 3D to the true thickness of the mineralization. Supported by measurements, the mean density value of the domain was applied to the blocks inside mineralized domains and alteration envelopes, with density values ranging from 2.80 to 3.09 g/cm3. High-grade capping was applied to raw assay data and established on a per-zone basis, ranging between 15 g/t Au and 100 g/t Au for the mineralized domains, and a fixed capping value of 5 g/t Au for the alteration envelopes. 1.0 m composites were calculated within the mineralized domains and alteration envelopes using the grade of the adjacent material when assayed or a value of 0.001 when not assayed.
- The cut-off grades for the Fenelon deposit were calculated using a gold price of US$2,250/oz; a USD/CAD exchange rate of 1.35; a refining cost of $5.00/t; a processing cost of $30.00/t; a mining cost of $5.75/t (bedrock) or $5.95/t (overburden) for the surface portion; a mining cost of $90.00/t for the underground portion; and a G&A cost of $10.00/t. A metallurgical recovery of 95.0% and royalty of 4.0% were applied to the cut-off grade calculations.
- The cut-off grades for the Martiniere deposit were calculated using a gold price of US$2,250/oz; a USD/CAD exchange rate of 1.00:1.35; a refining cost of $5.00/t; a processing cost of $30.00/t; a mining cost of $5.75/t (bedrock) or $5.95/t (overburden) for the surface portion; a mining cost of $125.00/t for the underground portion using the long-hole mining method (“LH”), a mining cost of $135.00/t for the underground portion using the cut-and-fill mining method (“CF”); and a G&A cost of $10.00/t. A metallurgical recovery of 85.0% and royalty of 2.0% were applied to the cut-off grade calculations. The metallurgical recovery is based upon a metallurgical characterization study completed in December 2024 (SGS, 2024; Wallbridge news release dated December 19, 2024).
- Tonnage estimates are reported to the nearest 1000 tonnes (000’s). Contained gold estimates are reported to the nearest 1000 troy ounces (000’s).
- These mineral resources are not mineral reserves as they do not have demonstrated economic viability.
- The QP is not aware of any known environmental, permitting, legal, title-related, taxation, sociopolitical or marketing issues, or any other relevant issue, that could materially affect the potential development of mineral resources other than those discussed in the 2025 MREs.
- Results are presented in situ. Ounce (troy) = metric tons x grade/31.10348. Any discrepancies in the totals are due to rounding effects; rounding followed the recommendations as per NI 43-101.
The reader should note that the 2025 PEA does not include the Martiniere deposit mineral resource estimate.
Mining
The mine will have a production rate of 3,000 tonnes per day (“tpd”) over a 16-year LOM.
A total of 16.6 Mt of mineralized material at an average grade of 3.34 g/t will be extracted from three different mining zones:
- Contact-Tabasco-Cayenne (“C-T-C”), with 54.6% of the ounces to be mined;
- Area 51, with 44.9% of the ounces to be mined; and
- Gabbro open pit, with 0.5% of the ounces to be mined.
The mining method will be long hole with longitudinal stopes measuring 5 to 8 m wide, corresponding to 44% of the stope tonnage. Transverse stopes are designed for stopes 8 to 15+ m wide, which account for 56% of the remaining stope tonnage.
Stope dimensions are 30 m (Area 51 zone) to 40 m (C-T-C zones) high, 5 to 15 m wide, and 20 m long. The average stope size in all zones is approximately 15,000 t. An average of 70 stopes will be mined annually. Mining recovery is estimated at 95%. Stope backfilling will be done mostly with paste backfill (66%) or cemented rock fill (2%) or rock fill (32%), depending on the stope dimensions and sequence.
A mining contractor will carry out development during pre-production. Starting in pre- production Year -1, the development will be done with the owner’s equipment and personnel. The priority is to develop the main C-T-C ramp and access production horizon.
The mining fleet, comprised of a maximum of 66 pieces of mobile equipment, will be purchased via a financing agreement. Supporting underground infrastructure includes two ventilation intake raises and heating systems, and one exhaust raise.
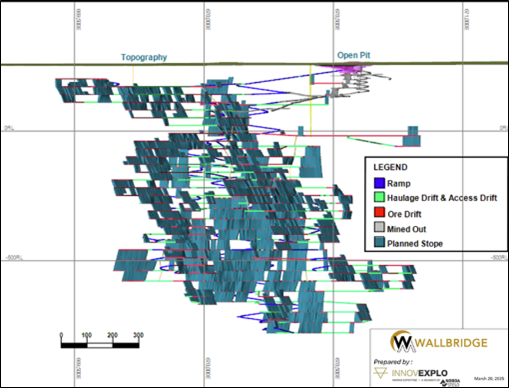
Figure 3. Overview of the Fenelon Project on a Longitudinal View Looking North
Metallurgy
The main metallurgical testwork program was conducted in two phases, in 2020 and 2021, on material from the Area 51 and C-T-C zones by SGS Canada Inc.
Grindability testing, including semi-autogenous grinding (“SAG”) mill comminution testing, was completed in 2021. The samples were characterized as hard in terms of resistance to impact breakage during the SMC test, with A×b drop weight test values ranging from 23 to 31. The Bond rod mill work index results ranged from 15.6 to 16.9 kWh/tonne, classifying the material as moderately hard to hard. The Bond ball mill work index ranged from 13.4 to 16.2 kWh/tonne, indicating a medium hardness range.
Gravity gold recovery testing was performed in 2021 on a representative composite sample from the C-T-C and Area 51 zones. The testwork results for E-GRG (Extended Gravity Recoverable Gold) showed gold recoveries of up to 82% for the Contact zone and 90% for the Area 51 zone, aligning with the results from prior testing conducted in 2020. These findings confirm the necessity of incorporating a gravity circuit in the process flowsheet.
Cyanidation testing was conducted in 2020 on representative samples following gravity recovery. Overall gold recoveries ranged from 94.6% to 96.9% for the C-T-C zones and from 95.3% to 97.1% for the Area 51 Zone.
Based on the metallurgical testwork conducted in 2020 and 2021, and considering the planned process flowsheet, the estimated average payable gold recovery for the process plant is expected to be 96.0% over the LOM.
Processing
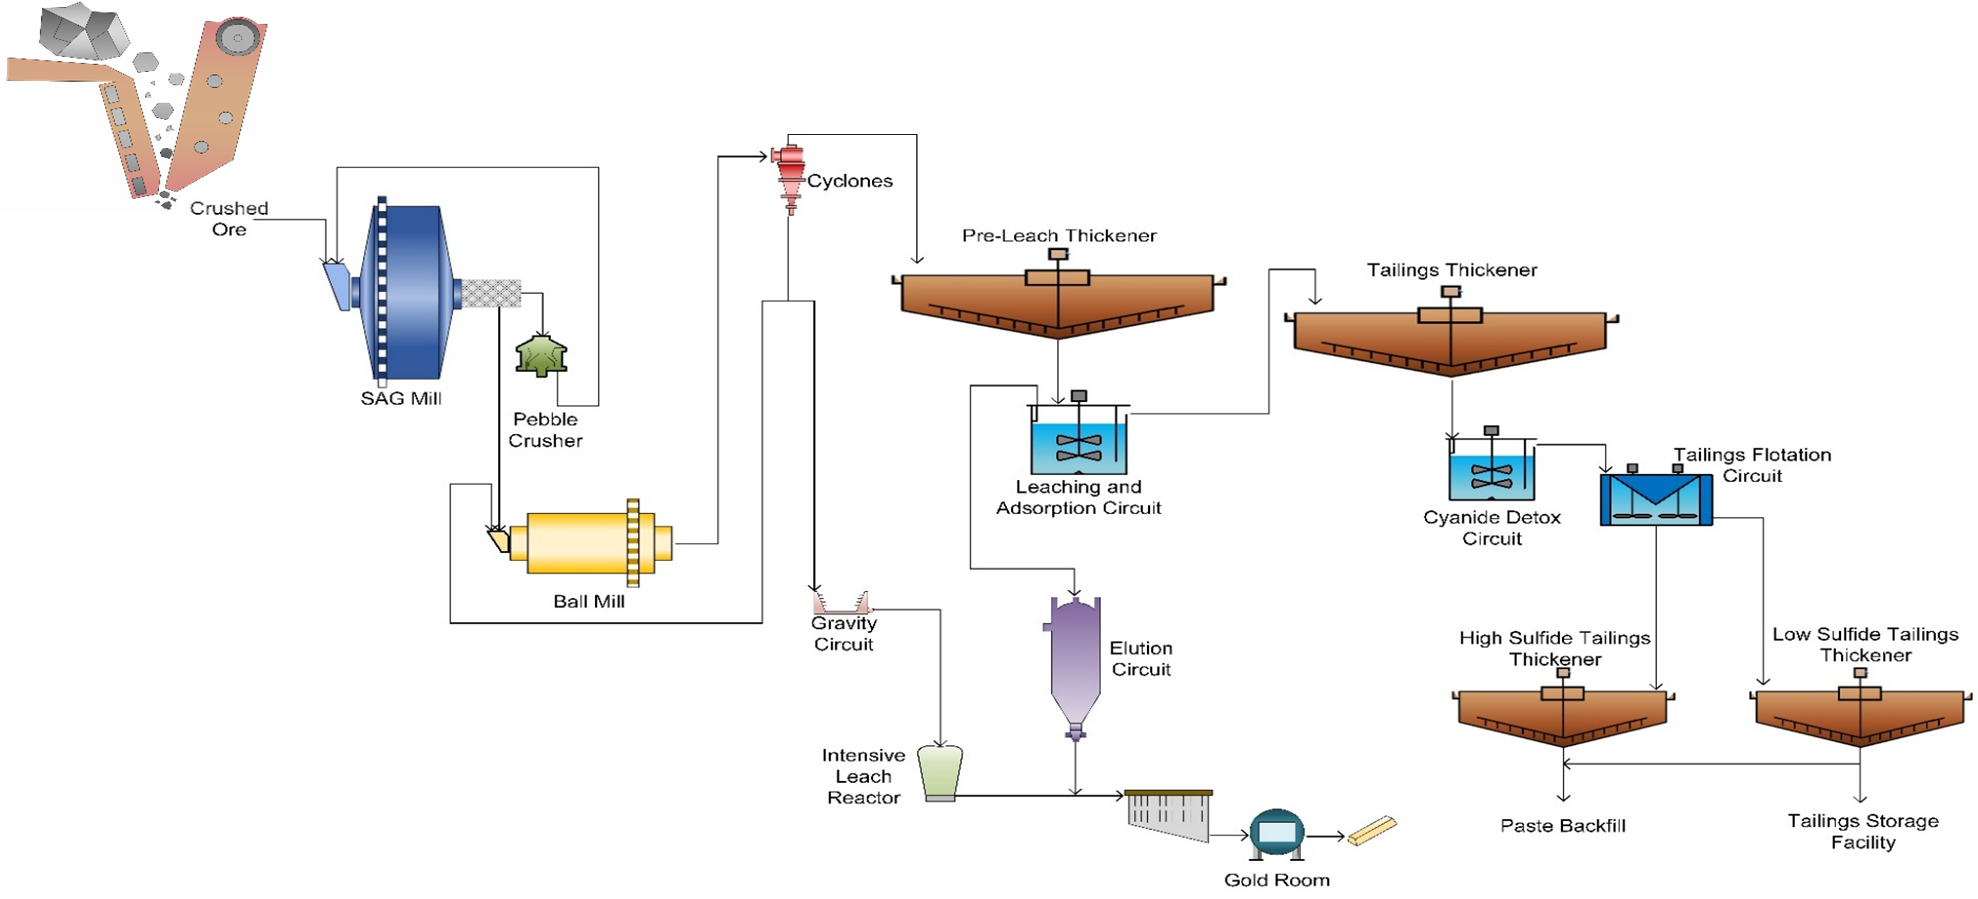
The process plant is designed to treat a total of 3,000 tpd of material. It will incorporate a SAG mill operating in closed circuit with a pebble crusher, and a ball mill in closed circuit with cyclones, forming a Semi-Autogenous Ball Mill Crusher circuit.
Gold recovery will be achieved through a leaching circuit. The cyclone overflow will be processed through a pre-leach tank, followed by a seven-tank carbon-in-leach (“CIL”) circuit and an SO2/Air cyanide destruction system. Gold will be recovered via an adsorption-desorption-recovery circuit using the Zadra process, followed by electrowinning cells. The final gold product will be refined in the gold room, where gold bars will be produced and subsequently shipped to facilities for purification.
The SO2/Air cyanide detoxification circuit will be followed by a tailings flotation circuit, where the sulphide concentrate will be utilized for paste backfill to be sent underground and/or non sulphide to produce dried tailings for tailings storage.
The process plant facility will also include, a mill maintenance workshop, administrative offices, and a dry room.
Project Infrastructure
The Project is approximately 75 km from the town of Matagami. It can be accessed from highway 810 via a 24-km forestry road. The existing Fenelon camp includes a welcome center, a 155-room dormitory, a dry, a kitchen, a dining room, a game room, a workshop and a First Nations cultural centre.
The existing camp and mine site include a core shack, modular offices, a garage, a water treatment plant, an air ventilation-heating system to serve the underground openings, an open pit and a portal connecting to an underground ramp. The camp and mine site are served by diesel generators for electricity production. All these facilities will be used at the start of the Project and will be upgraded, expanded or replaced during construction and operations.
The mining and processing infrastructure will be located on the Fenelon site. The Project envisions the upgrade of existing surface infrastructure: site access road, potable water and sewage systems, underground mine portal, mine ventilation systems (intake and exhaust), main and remote gatehouses, surface maintenance shop, waste rock stockpile, overburden stockpile, and mineralized material stockpile. The Project will require construction of the following infrastructure items: 3,000 tpd process plant complex, paste plant, offices, dry, truck shop and warehouse; 4 km of new 120kV overhead transmission line from the connection point to HydroQuebec up to a new 120-69 kV substation; from this point, a new 69kV overhead line will run for 22 km up to the new site substation (69kV-25kV); final effluent water treatment plant; surface water management facility, including ditches, pond and pumping stations; service and haulage roads; and tailings management facility.
The camp will be expanded to 250 rooms with associated kitchen, dining room and game- exercise room. A local office is planned in a nearby town to support administration, communication, human resources and technical personnel.
Underground Infrastructure
The main ventilation intake is a 4 m diameter raise bored from L-270 to the surface in two sections, serving as the primary fresh air intake with high-efficiency surface fans. Exhaust air will exit mainly through the main ramp.
Underground infrastructure includes a service bay on L-520, which will accommodate a welding bay, garage, tire storage, washing bay, small warehouse, greasing bay, fuel bay, and parking. The garage will allow for simultaneous maintenance of two large equipment units and one smaller unit, ensuring efficient underground operations.
Underground refuge stations are strategically located within 1,000 m to ensure accessibility.
Mine dewatering will be managed through separate systems for contact and non-contact water. Contact water, collected from groundwater inflow and mine operations, will be directed to three main pumping. Non-contact water will be channeled down to a dedicated pumping station. Each Pumping station will be equipped with three centrifugal pumps (two in operation, one on standby).
Pump stations and powder magazines are not explicitly included in the design but have been accounted for in the equivalent meter contingency, with associated costs incorporated into the financial model.
Tailings and Waste Rock Management
Tailings from mill operations will be managed in two streams: used as underground paste backfill or disposed on the surface as filtered tailings in a dry stack facility (85% solids). Tailings will be pumped either to the paste backfill plant (via the filter plant for pre- processing) or to a filter plant before being trucked to the tailings storage facility (“TSF”).
The selection of the site for surface tailings disposal was advanced in previous studies. The proposed site is located 1.0 km northwest of the mill. In this area, the topography is relatively flat, and the site is surrounded by a natural stream, a conceptual high-water mark was outlined. The perimeter of the facility’s footprint was placed at 30 m from the conceptual line.
Given the low potential for acid mine drainage and metal leaching of the surface tailings facility, the current design, as proposed, is not lined. It is noted, however, the geochemical testing is ongoing and should the addition of the membrane be required this can increase costs significantly and should be included, in such a case, in future designs. It is further noted that Wallbridge has elected to include a desulphurization plant, with the residual sulphur content being below the threshold limits of the new Directive 019. All things considered this study has not included a membrane to encapsulate the tailings.
The paste mixer is a horizontal twin shaft mixer with a capacity of 3 m³. In the mixer, the filtered desulphurized tailings are mixed with binder (90/10 slag cement binder was selected from the preliminary uniaxial compressive strength results) and thickened sulphide tailings from the holding tank to form paste backfill. The mixer will be fitted with an adjustable slump water stream to control the density of the paste. After mixing, the paste backfill is pumped to the borehole feeding the underground paste distribution system using one positive displacement piston pump.
As conceptualized, all development waste rock will be used to fill underground voids at some point in the mine life. A portion of the material will have to be temporarily stored on surface, while stopes are being mined out. The limited geochemistry available has indicated that the development waste is both PAG and metal leaching. As such this has been considered in the design of the waste pile which will store 0.84 Mm3 of material at its peak.
Water Treatment
All contact water, including groundwater, surface runoff and tailings and waste rock storage facilities drainage shall be collected and treated at the water treatment plant before being discharged to the environment.
The water treatment plant (“WTP”) will be located near the TSF water basin. A settling pond will decant solids from the underground dewatering. An MBBR reactor (moving bed biofilm reactor) will remove ammonia and/or other nitrogen-based contaminants present in water from both underground dewatering and TSF. Finally, MBBR-treated water and other contact water containing suspended solids and metals will be removed in a high-rate clarifier by following treatment steps such as metal precipitation, coagulation, flocculation, and clarification. The final effluent from the WTP will be discharged into the environment by gravity, and its quality will be monitored in an effluent quality monitoring station.
Environment and Permitting
In Northern Quebec (James Bay region located south of the 55th parallel), all mining development projects must follow the environmental assessment (“EA”) and review procedures under the Regulation Respecting the Environmental and Social Impact Assessment and Review Procedure applicable to the territory of James Bay and Northern Quebec. With a planned production capacity of 3,000 per day, the mining project does not exceed the 5,000 per day threshold for the federal environmental assessment procedure set out in the Physical Activities Regulations (SOR/2019-285). Therefore, no environmental assessment in compliance with the requirements of the federal Impact Assessment Act (S.C. 2019, c. 28, s. 1) will be required.
The acquisition of baseline environmental knowledge on the Project began several years ago and is still ongoing today. To date, preliminary environmental characterizations of the physical environment and biological environment have been carried out and/or are ongoing. Confirmation of the regulatory context made it possible to identify the scope of the environmental studies required to obtain environmental authorizations. Inventory work is underway to fill these gaps.
To date, no major environmental issues have been identified in the work undertaken. The situation of the woodland caribou, designated as vulnerable in Quebec and threatened at the federal level, remains uncertain to date in the Project area with regard to future legal protection of its habitat.
A preliminary geochemical characterization program has been in progress since 2020 to identify the geo-environmental characteristics of mineralized material and mine wastes and classify their environmental risk (e.g., for acid rock drainage and metal leaching) based on Quebec provincial guidance documents. Findings from the geochemical study have been incorporated into the Project design.
Closure Plan
A closure and rehabilitation plan for the land affected by the Project will be prepared and submitted for authorization. The preliminary concept for site closure is estimated at $11.5 million. The current financial deposit for site closure is estimated at $2.9 million for a net closure cost of $8.6 million.
Figure 4. Process Flow Sheet
Stakeholder Engagement
Wallbridge conducts consultation activities with the Cree communities of Waskaganish and Washaw Sibi, and the Cree Nation Government. It also consults with the Algonquin Abitibiwinni First Nation through weekly meetings, site visits and monthly bulletins. In addition, Wallbridge follows a formal consultation plan and schedule developed as part of the 2019 ESIA process. The plan aims to identify and communicate with potentially interested and/or impacted First Nations and stakeholders. The First Nations consultation activities include:
- Meetings and traditional knowledge workshops with the Tallyman
- Meetings with the First Nation leaders
- Participating in a mining workshop and community feast in Waskaganish
- Project update bulletins
- Weekly scheduled meetings with each community and other frequent discussions as needed
- Assisting with business development and employment opportunities
- Site visits
- Assisting local Tallyman by providing assistance or accommodation when needed.
Workforce
Wallbridge’s hiring and contracting policy is to hire First Nations and local community members or service providers when possible.
Consultation activities with the municipalities, associations, organizations and political stakeholders have included project update correspondence, meetings with the municipalities and their chambers of commerce, and meetings with interested organizations.
Wallbridge actively collaborates with the town of Matagami, the Société de Développement de la Baie-James, the Société du Plan Nord and the Cree Nation Development Corporation to identify opportunities for employment and infrastructure development projects in the vicinity of the Project.
Independence and Responsibilities
The PEA was prepared for Wallbridge Mining by independent consulting firms with their respective responsibilities listed in Table 7. The Qualified Persons (“QP”) are not aware of any environmental, permitting, legal, title, taxation, socio-economic, marketing, political, or other relevant factors that could materially affect the PEA. Each QP has reviewed and approved the content of this news release.
All scientific and technical data contained in this news release has been reviewed and approved by Mr. Marc R. Beauvais, P.Eng, of InnovExplo, who was responsible for compiling the PEA technical report. By virtue of his education, membership in a recognized professional association and relevant work experience, Mr. Beauvais is an independent QP as defined by NI 43-101.
All scientific and technical data related to the MREs contained in this document has been reviewed and approved by Mr. Mauro Bassotti (P.Geo.) who is an independent mineral resource consultant and a QP as defined by NI 43-101.
The Company cautions that the results of the PEA are preliminary in nature and include (i) indicated mineral resources with potential quantity and grades that are conceptual in nature, with insufficient exploration to define as a mineral resource and that it is uncertain if further exploration will result in the target being delineated as a mineral resource; and (ii) inferred mineral resources that are considered too speculative geologically to have economic considerations applied to them to be classified as mineral reserves. There is no certainty that the results of the PEA will be realized.
Table 7: Consulting Firm, Area of Responsibility and Qualified Person
| Consulting Firms | Area of Responsibility | Qualified Person |
| M.B. Consulting Mineral Resource Consultant |
|
|
| InnovExplo Inc. / Norda Stelo |
|
|
| InnovExplo Inc. / Norda Stelo |
|
|
| G-Mining Services |
|
|
| BBA Inc. |
|
|
The QPs mentioned above have reviewed and approved their respective technical information contained in this news release.
The reader is advised that the PEA summarized in this news release is intended to provide only an initial, high-level review of the project potential and design options. The PEA mine plan and economic model include numerous assumptions and the use of inferred mineral resources. Inferred mineral resources are considered to be too speculative to be used in an economic analysis except as allowed for by NI 43-101 in PEA studies. There is no guarantee that inferred mineral resources can be converted to indicated or measured mineral resources, and as such, there is no guarantee the project economics described herein will be achieved.
A NI 43-101 technical report supporting the PEA has been filed on SEDAR+ and is available on the Company’s website.
Webcast
Wallbridge management will host a webinar to discuss the Fenelon PEA results.
Date and Time: Tomorrow, Friday March 28, 2025, starting at 10:00 AM EDT
Registration: To participate in the webinar, please register here:
https://6ix.com/event/wallbridge-mining-corporate-update
A presentation that summarizes the PEA results of the Project will be available on the Company’s website at 10:00 AM EDT on Friday, March 28, 2025.
About Wallbridge Mining
Wallbridge is focused on creating value through the exploration and sustainable development of gold projects in Quebec’s Abitibi region while respecting the environment and communities where it operates. The Company holds a contiguous mineral property position totaling 830 km2 that extends approximately 97 km along the Detour-Fenelon gold trend. The property is host to the Company’s flagship PEA stage Fenelon Gold Project, and its earlier exploration stage Martiniere Gold Project, as well as numerous other gold exploration projects.
For further information please visit the Company’s website at https://wallbridgemining.com/ or contact:
| Brian Penny, CPA, CMA CEO Email: bpenny@wallbridgemining.com M: +1 416 716 8346 |
Tania Barreto, CPIR Director Investor Relations Email: tbarreto@wallbridgemining.com M: +1 289 819 3012 |
Cautionary Note Regarding Forward-Looking Information
This news release contains forward-looking statements or information (collectively, “FLI”) within the meaning of applicable Canadian securities legislation. FLI is based on expectations, estimates, projections, and interpretations as at the date of this news release.
All statements, other than statements of historical fact, included herein are FLI that involve various risks, assumptions, estimates and uncertainties. Generally, FLI can be identified by the use of statements that include words such as “seeks”, “believes”, “anticipates”, “plans”, “continues”, “budget”, “scheduled”, “estimates”, “expects”, “forecasts”, “intends”, “projects”, “predicts”, “proposes”, "potential", “targets” and variations of such words and phrases, or by statements that certain actions, events or results “may”, “will”, “could”, “would”, “should” or “might”, “be taken”, “occur” or “be achieved.”
FLI herein includes, but is not limited to, statements regarding the results of the PEA, including the production, operating costs, capital expenditures and total cash cost estimates, the projected valuation metrics and rates of return, and the cash flow projections, as well as the anticipated permitting requirements and Project design, including processing and tailings facilities, infrastructure developments, metal recoveries, mine life and production rates for the Project, the potential to further enhance the economics of the Project and optimize the design, potential timelines for obtaining the required permits and financing, parameters and methods used to estimate the mineral resource estimates (each an “MRE”) at Fenelon and Martiniere (collectively the “Deposits”); the prospects, if any, of the Deposits; future drilling at the Deposits; and the significance of historic exploration activities and results. Forward-looking information is not, and cannot be, a guarantee of future results or events.FLI is designed to help you understand management’s current views of its near- and longer-term prospects, and it may not be appropriate for other purposes. FLI by their nature are based on assumptions and involve known and unknown risks, uncertainties and other factors which may cause the actual results, performance, or achievements of the Company to be materially different from any future results, performance or achievements expressed or implied by such FLI. Although the FLI contained in this document is based upon what management believes, or believed at the time, to be reasonable assumptions, the Company cannot assure shareholders and prospective purchasers of securities of the Company that actual results will be consistent with such FLI, as there may be other factors that cause results not to be as anticipated, estimated or intended, and neither the Company nor any other person assumes responsibility for the accuracy and completeness of any such FLI. Except as required by law, the Company does not undertake, and assumes no obligation, to update or revise any such FLI contained in this document to reflect new events or circumstances. Unless otherwise noted, this document has been prepared based on information available as of the date of this document. Accordingly, you should not place undue reliance on the FLI, or information contained herein.
Furthermore, should one or more of the risks, uncertainties or other factors materialize, or should underlying assumptions prove incorrect, actual results may vary materially from those described in FLI.
Assumptions upon which FLI is based, without limitation, include: the results of exploration activities, the Company’s financial position and general economic conditions; the ability of exploration activities to accurately predict mineralization; the accuracy of geological modelling; the ability of the Company to complete further exploration activities; the legitimacy of title and property interests in the Deposits; the accuracy of key assumptions, parameters or methods used to estimate the MREs and in the PEA; the ability of the Company to obtain required approvals; geological, mining and exploration technical problems; and failure of equipment or processes to operate as anticipated; the evolution of the global economic climate; metal prices; foreign exchange rates; environmental expectations; community and non-governmental actions; and, the Company’s ability to secure required funding. Risks and uncertainties about Wallbridge's business are discussed in the disclosure materials filed with the securities regulatory authorities in Canada, which are available at www.sedarplus.ca.
Non-IFRS Financial Measures
Wallbridge has included certain non-IFRS financial measures commonly used in the mining industry in this news release, such as initial capital expenditures, sustaining capital expenditures, total cash costs and all-in sustaining costs, which are not measures recognized under IFRS and do not have a standardized meaning prescribed by IFRS. As a result, these measures may not be comparable to similar measures reported by other companies. Each of these measures used are intended to provide additional information to the user and should not be considered in isolation or as a substitute for measures prepared in accordance with IFRS. Non-IFRS financial measures used in this news release and common to the gold mining industry are defined below.
Total Cash Costs and Total Cash Costs per Ounce
Total cash costs are reflective of the cost of production. Total cash costs reported in the PEA include mining (UG and OP), processing, water treatment and tailings, minesite G&A and royalty costs. Total cash costs per ounce is calculated as total cash costs divided by payable gold ounces.
All-In Sustaining Costs and All-In Sustaining Costs per Ounce
All-in sustaining costs and all-in sustaining costs per ounce are reflective of all of the expenditures that are required to produce an ounce of gold from operations. All-in sustaining costs reported in the PEA include total cash costs, sustaining capital expenditures, closure costs, but exclude corporate general and administrative costs. All-in sustaining costs per ounce is calculated as all-in sustaining costs divided by payable gold ounces.
A description of the significant cost components that make up the forward looking non-IFRS financial measures of total cash costs and all-in sustaining costs per ounce of payable gold produced is shown in the table below.
Free Cash Flow
Free cash flow was estimated as the amount of cash generated by Fenelon after all operating and capital expenditures have been paid.
Initial Capital Expenditures and Sustaining Capital Expenditures
Initial and sustaining capital expenditures in the PEA were estimated based on current costs received from vendors as well as developed from first principles, while some were estimated based on factored references and experience from similar operating projects. Initial capital expenditures represent the construction and development costs to achieve commercial production and sustaining capital expenditures represent the construction and development costs subsequent to commercial production.
| Payable Gold Ounces | LOM Costs (millions $) | US$ Per Ounce | |
| Cash Operating Costs | 1,711,000 | 1,763 | 763 |
| Royalties | 202 | 88 | |
| Total Cash Costs | 1,965 | 851 | |
| Sustaining Capital Expenditures and Closure Costs | 449 | 195 | |
| All-in Sustaining Costs | 2,414 | 1,046 |
Cautionary Note to United States Investors
Wallbridge prepares its disclosure in accordance with NI 43-101 which differs from the requirements of the U.S. Securities and Exchange Commission (the "SEC"). Terms relating to mineral properties, mineralization and estimates of mineral reserves and mineral resources and economic studies used herein are defined in accordance with NI 43-101 under the guidelines set out in CIM Definition Standards on Mineral Resources and Mineral Reserves, adopted by the Canadian Institute of Mining, Metallurgy and Petroleum Council on May 19, 2014, as amended. NI 43-101 differs significantly from the disclosure requirements of the SEC generally applicable to US companies. As such, the information presented herein concerning mineral properties, mineralization and estimates of mineral reserves and mineral resources may not be comparable to similar information made public by U.S. companies subject to the reporting and disclosure requirements under the U.S. federal securities laws and the rules and regulations thereunder.
Figures accompanying this announcement are available at
https://www.globenewswire.com/NewsRoom/AttachmentNg/6d8c7fb3-bc41-4216-850b-8e8c9f33e4ed
https://www.globenewswire.com/NewsRoom/AttachmentNg/27cc6bbf-fcb6-4102-a955-947aa976844c
https://www.globenewswire.com/NewsRoom/AttachmentNg/65e5206e-363e-4bc2-ad3f-a917ad6221f0
https://www.globenewswire.com/NewsRoom/AttachmentNg/bb13aaa5-0053-418b-975c-bba168a53cd9

![]()
Figure 1.
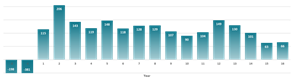
Annual After-Tax Free Cash Flow (millions)
Figure 2.
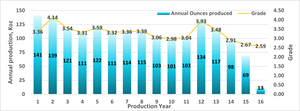
Production Profile
Figure 3.

Overview of the Fenelon Project on a Longitudinal View Looking North
Figure 4.
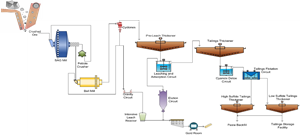
Process Flow Sheet
Distribution channels: Banking, Finance & Investment Industry, Mining Industry ...
Legal Disclaimer:
EIN Presswire provides this news content "as is" without warranty of any kind. We do not accept any responsibility or liability for the accuracy, content, images, videos, licenses, completeness, legality, or reliability of the information contained in this article. If you have any complaints or copyright issues related to this article, kindly contact the author above.
Submit your press release